javascript
react
d3
html5/css3
python
django
salesforce/apex
New America
October 2016 - Present
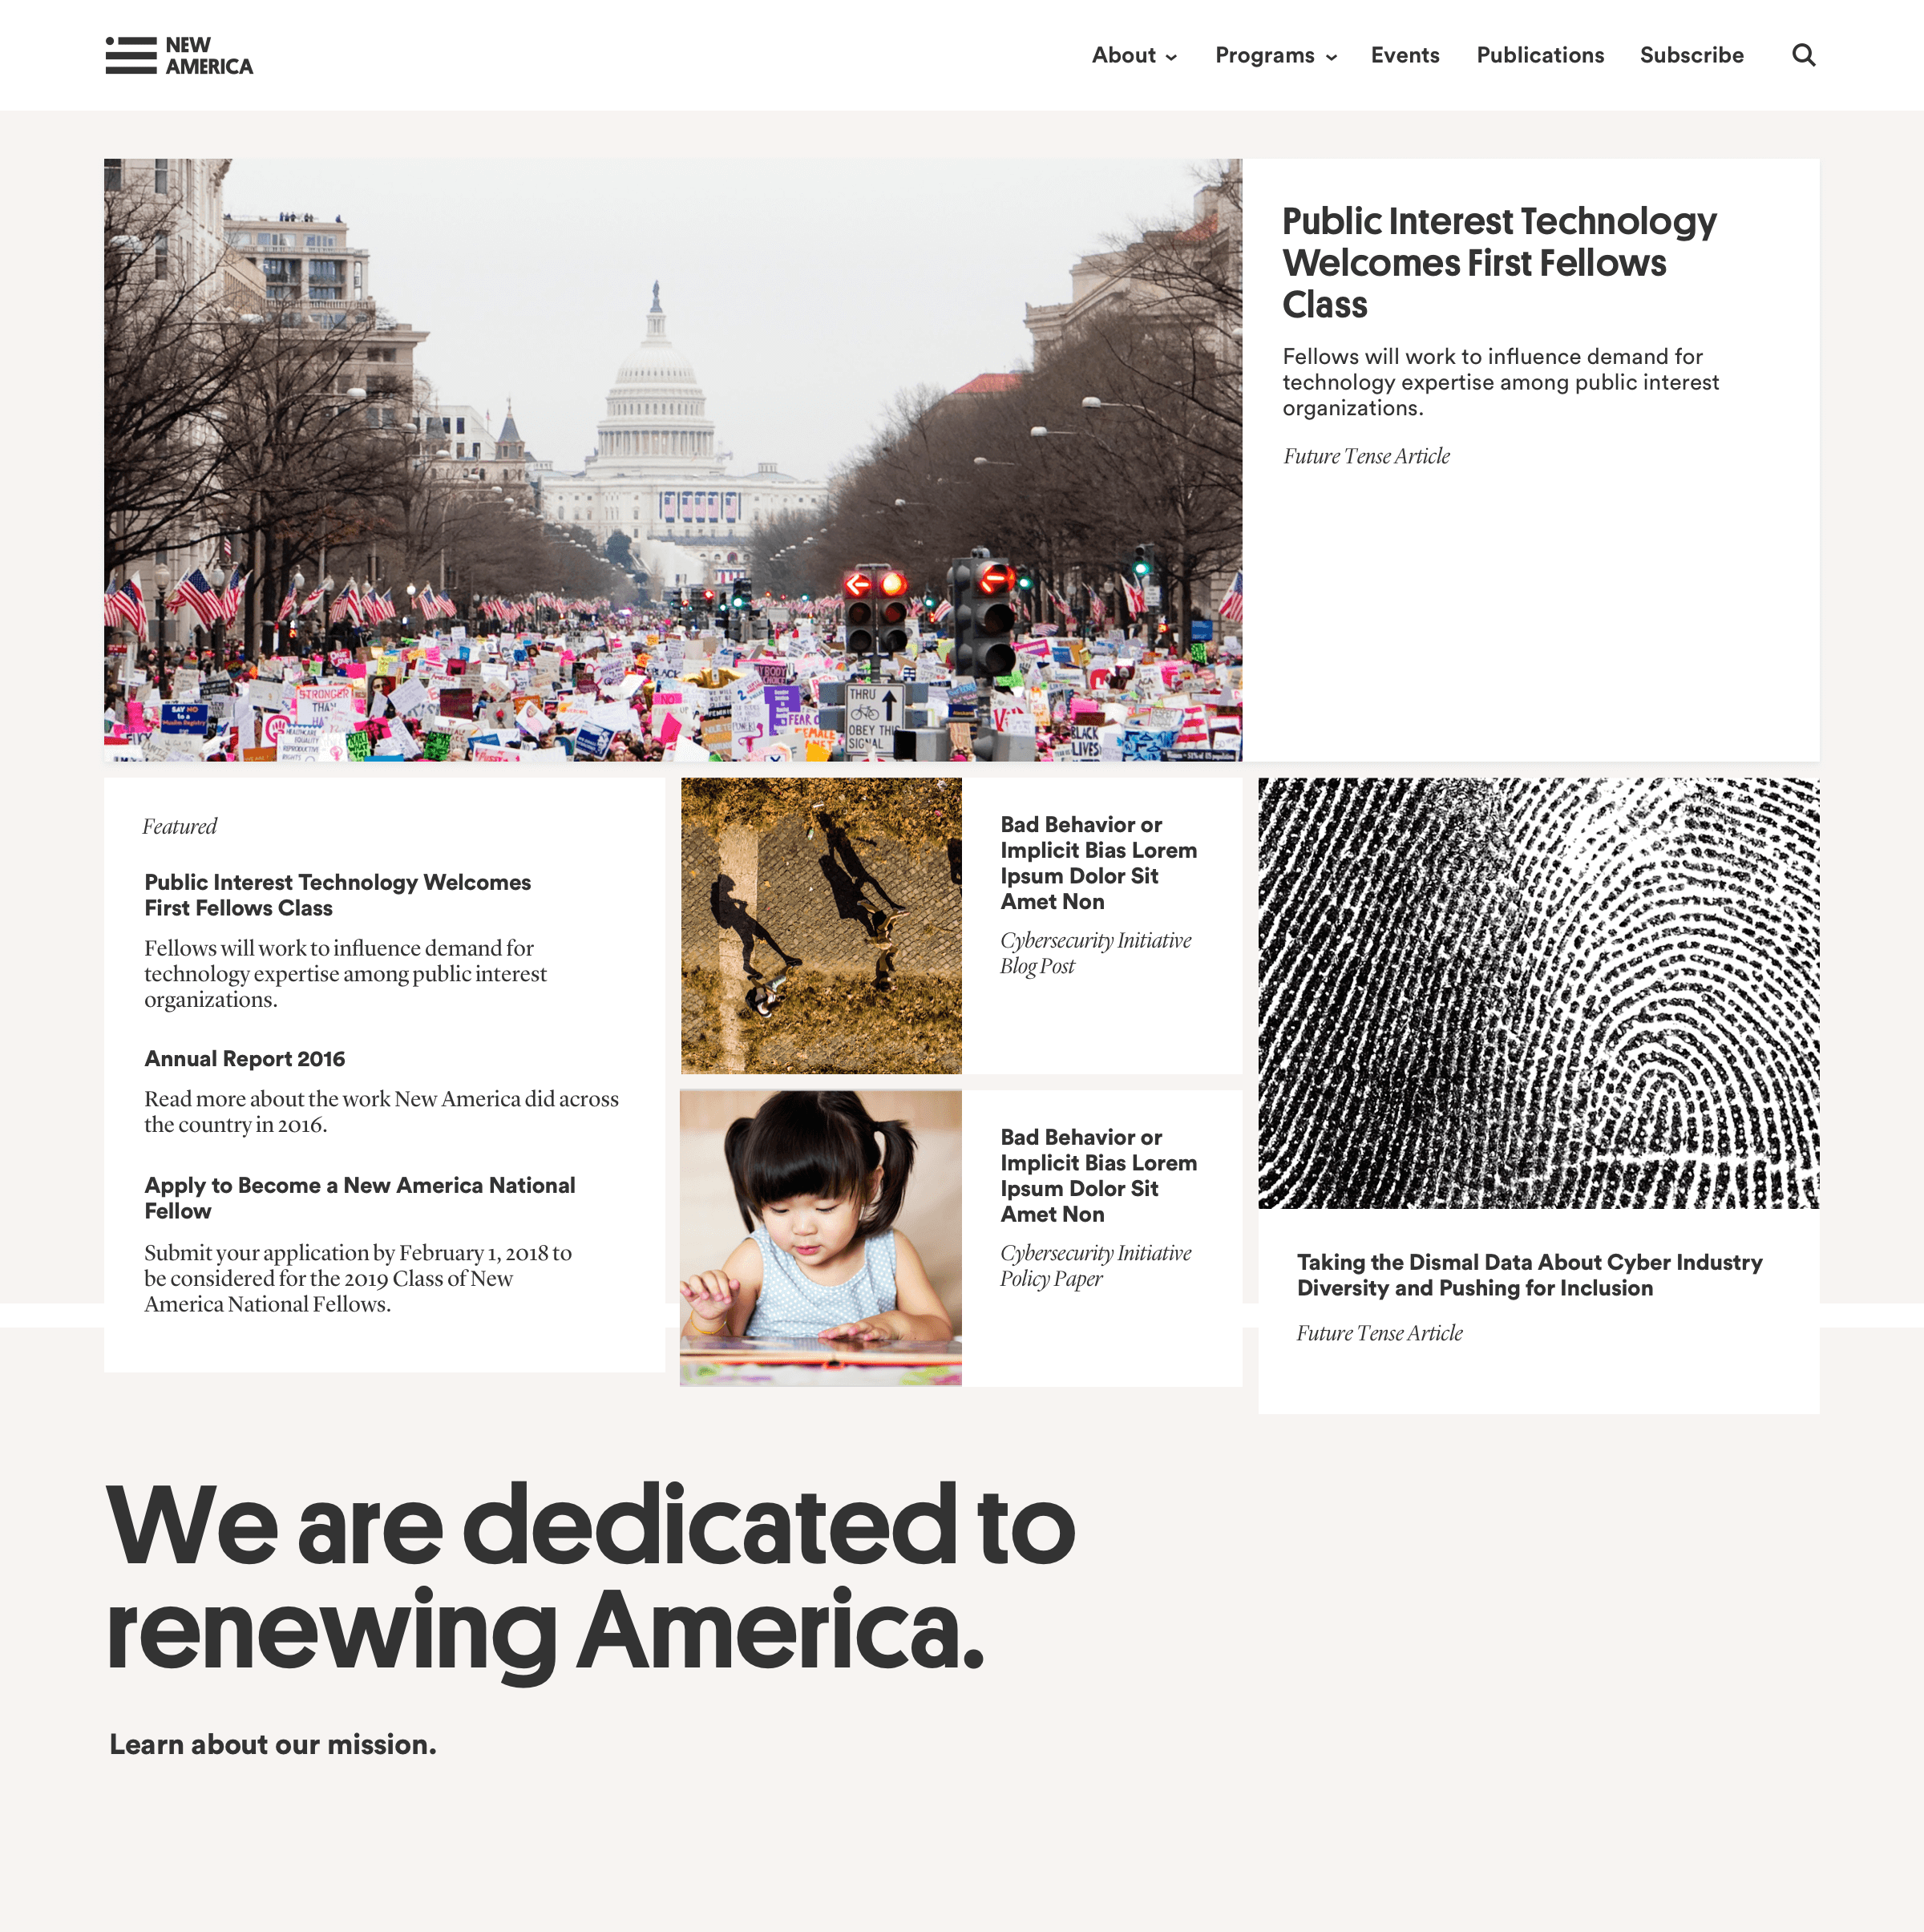
In 2018, I led the design, development and rollout of a refreshed newamerica.org. Our designer and I set out to reimagine the look, feel, navigation, and information architecture of the think tank’s 30+ policy team’s pages and publications.
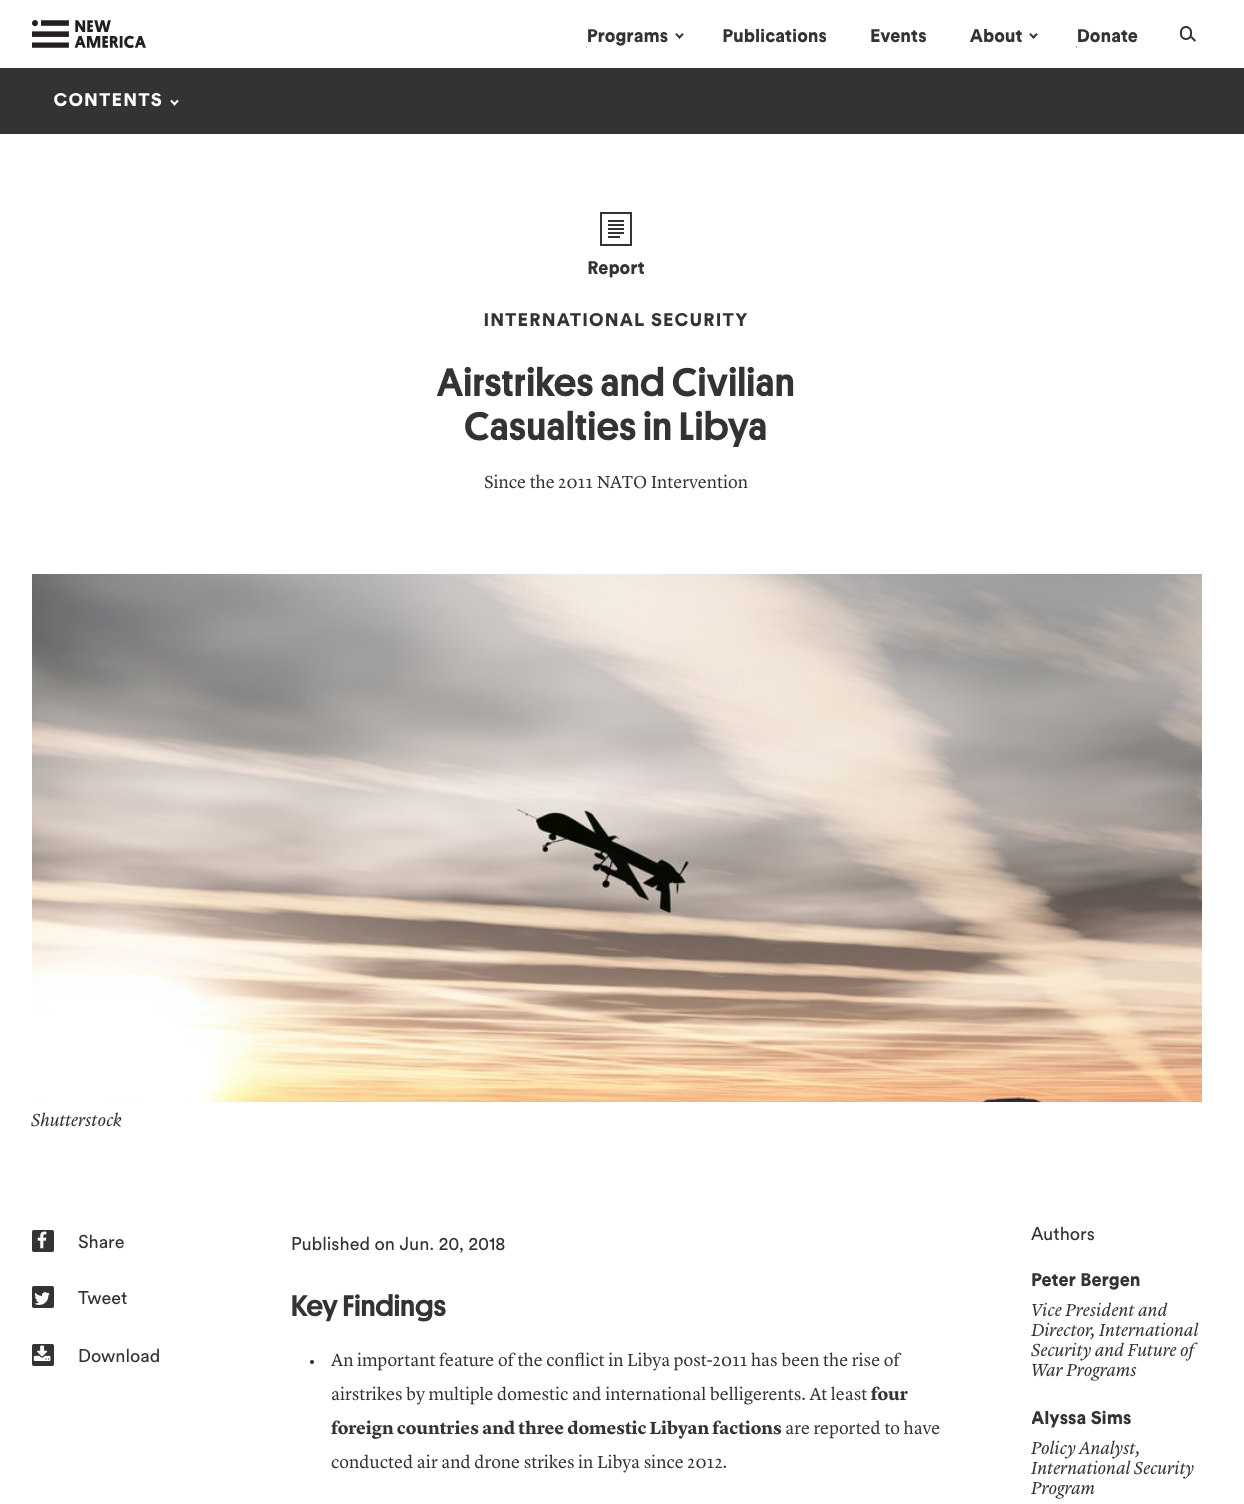
This wasn’t just a mere reskinning. We also completely overhauled and streamlined the organization’s publishing process, reducing the time from final copy to publication by half while also adding support for the full-text of policy papers online. We automated the layout of 90% of the organization’s PDFs (read more), increased support for custom interactive data visualizations, and rebuilt the site’s front-end from the ground up with react.
Center for American Progress
April 2015 - October 2016
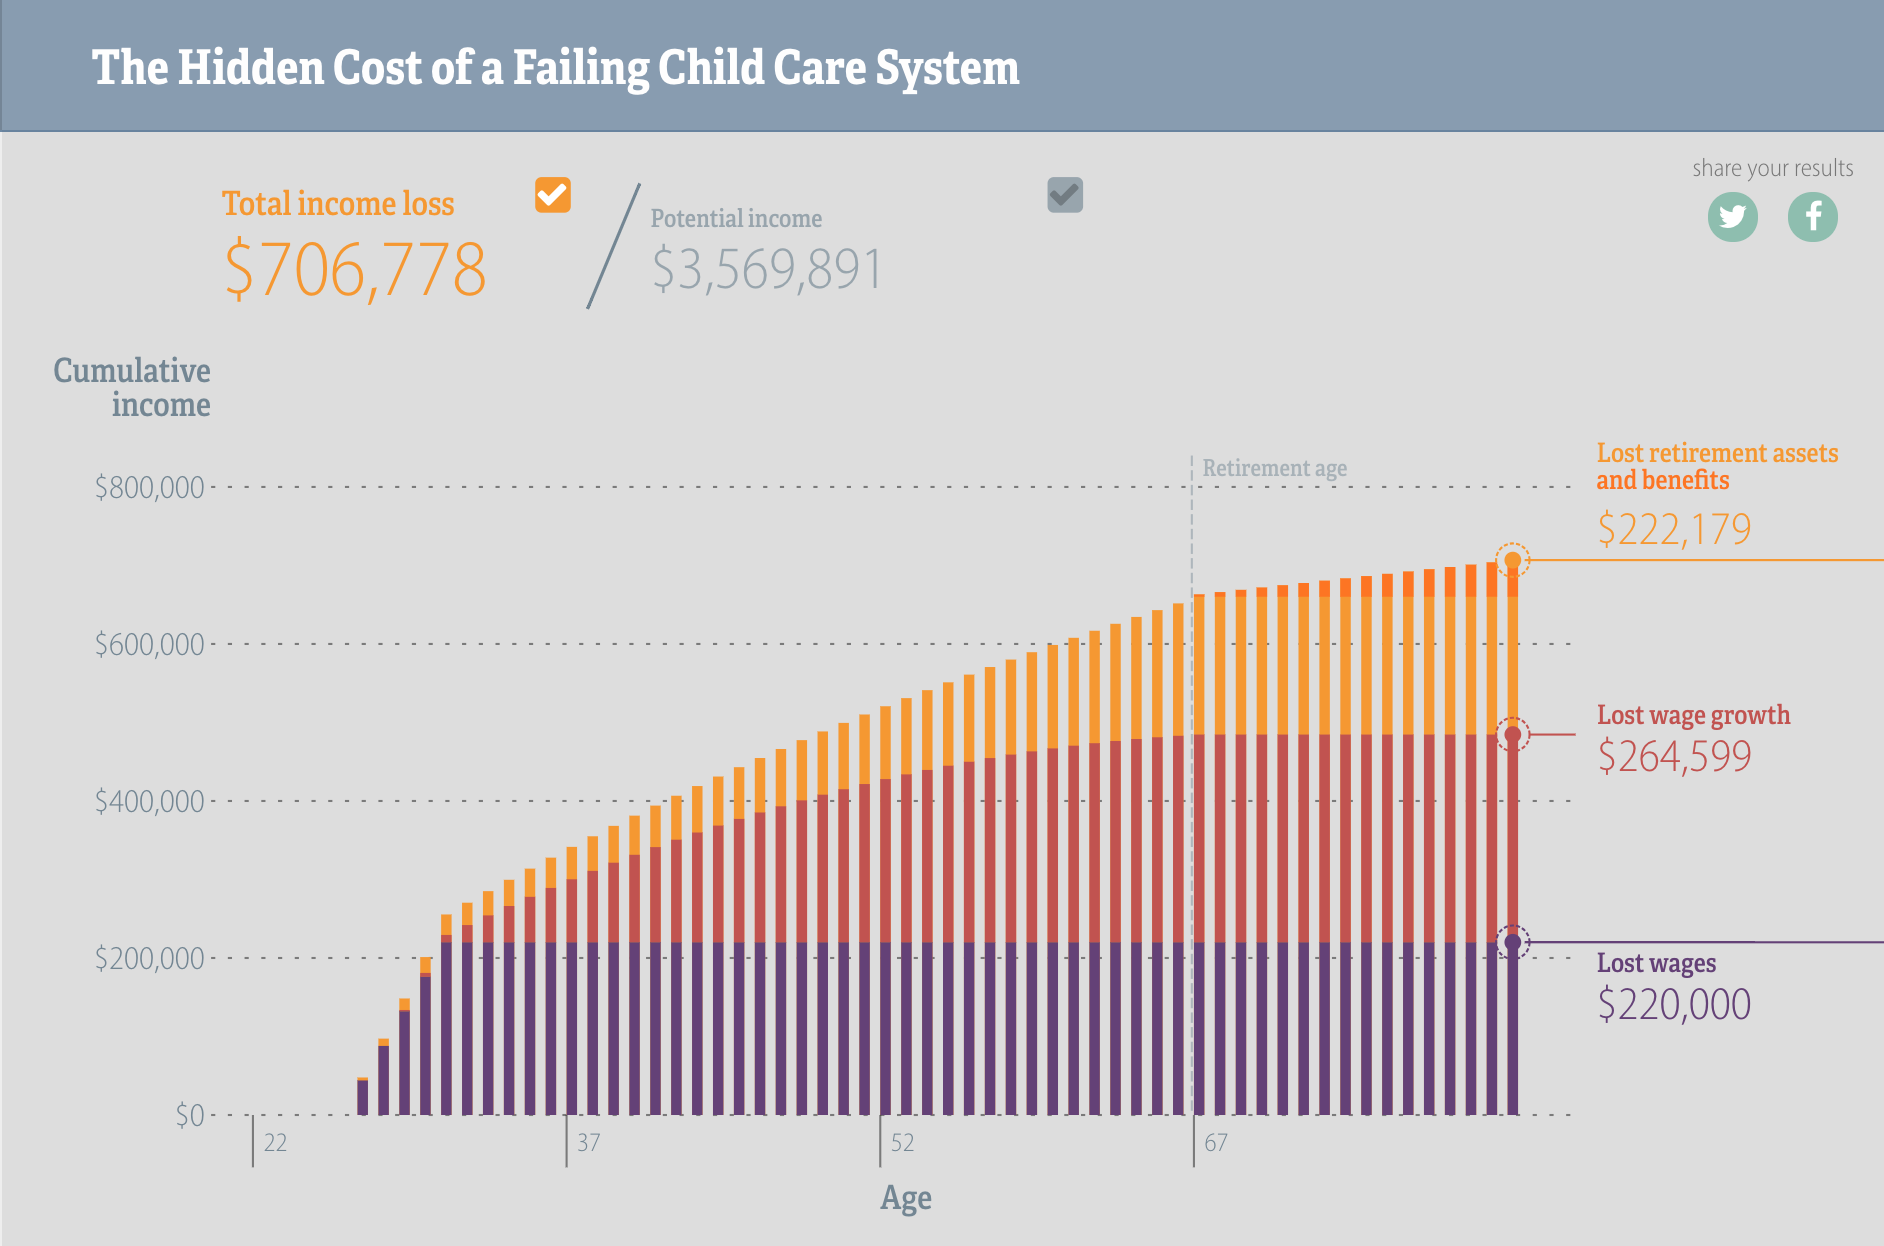
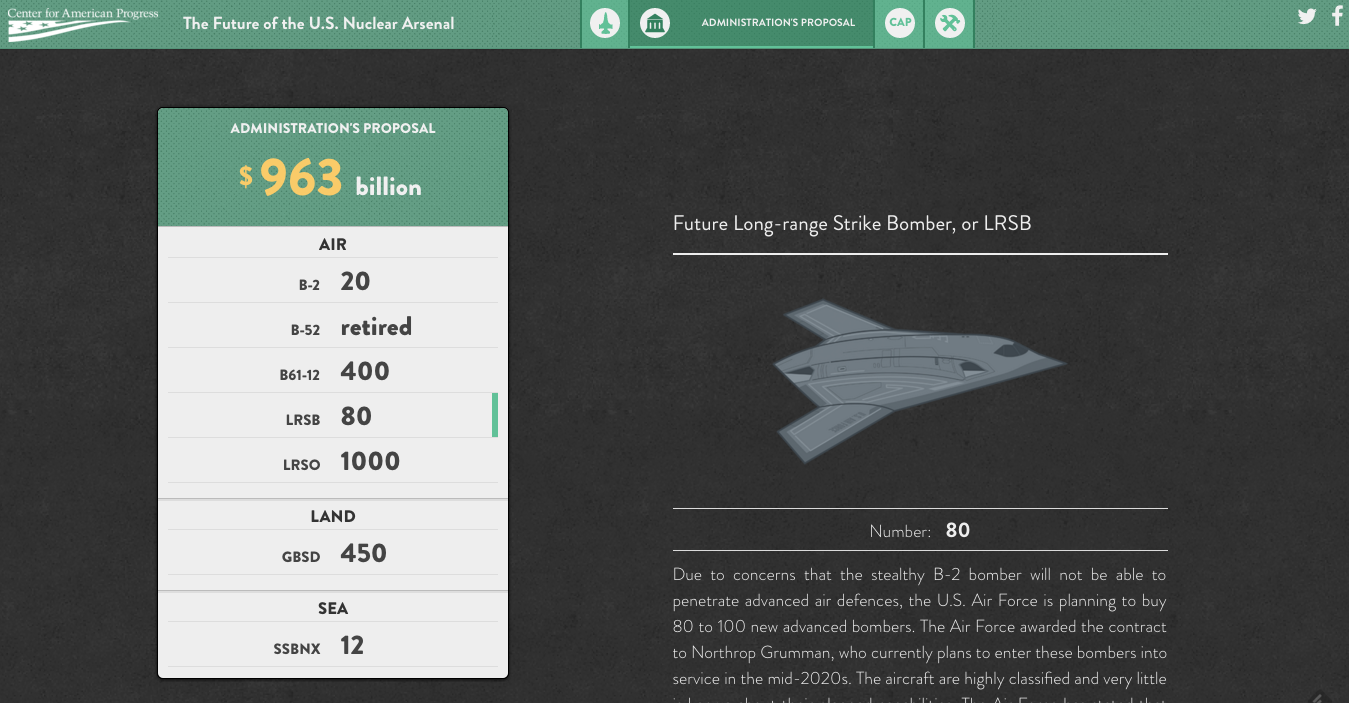
At CAP, I worked as a Data Visualization Developer, building around 25 interactives during my time there.
My goal was to create a consistent identity across graphics, a library of reusable charts, and a build process that simplifies creating and deploying ad-hoc graphics.
Examples: The Hidden Cost of a Failing Child Care System | The Future of America's Nuclear Arsenal | Blending American Youth
Bread for the City
April 2011 - April 2015
Bread for the City is a human services nonprofit in DC. I was initially hired in their medical clinic as a Data Analyst, building SQL reports for their MS Access database.
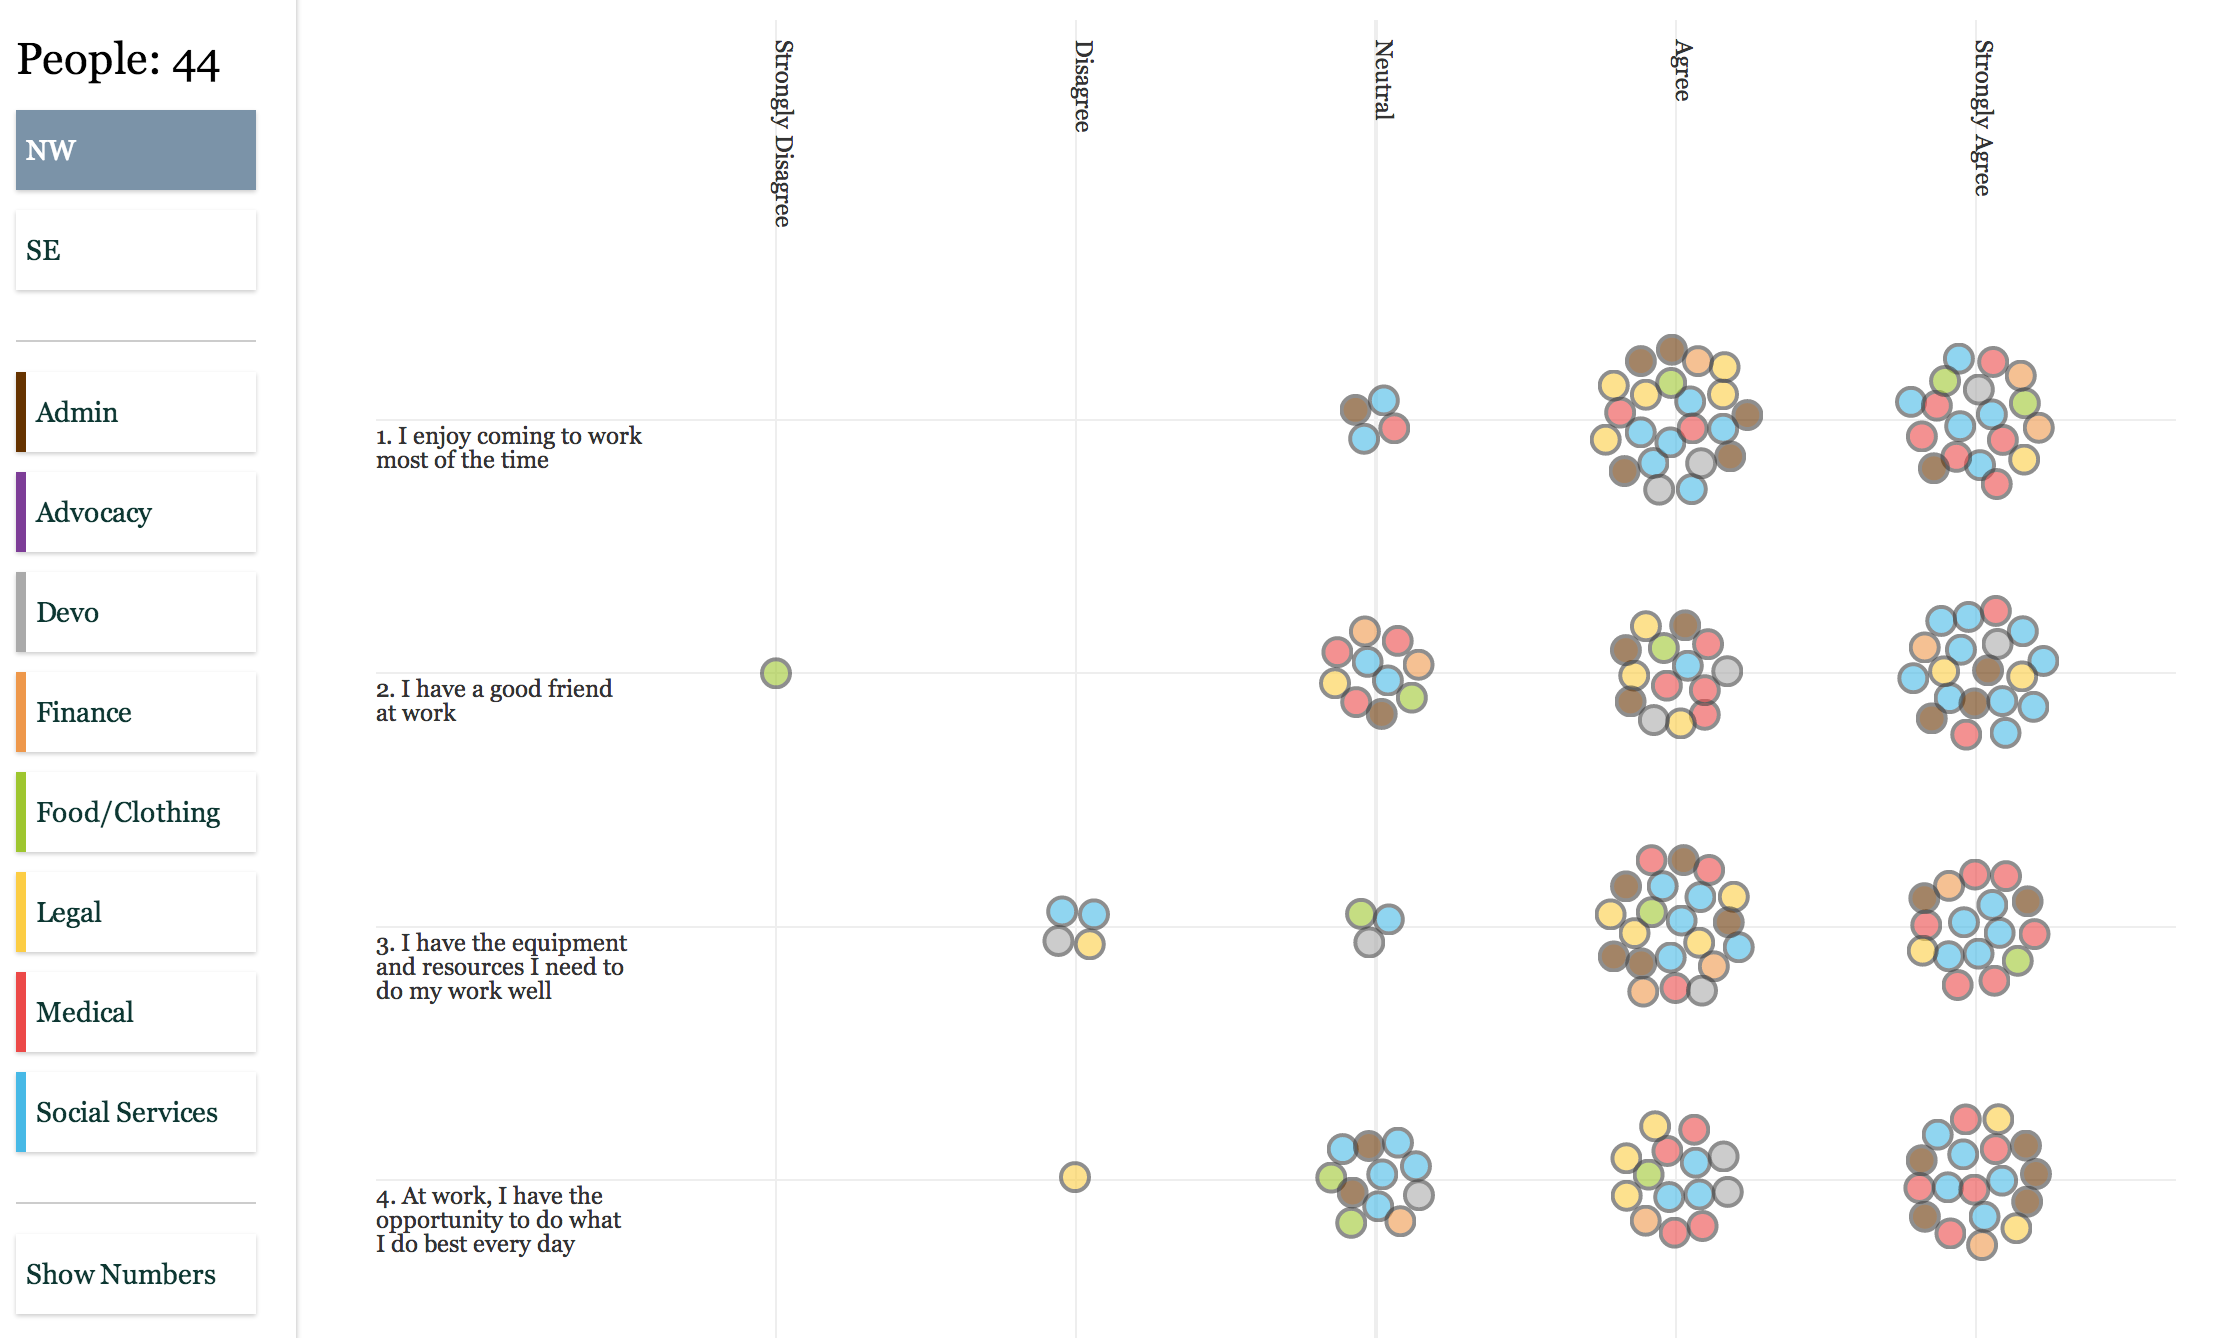
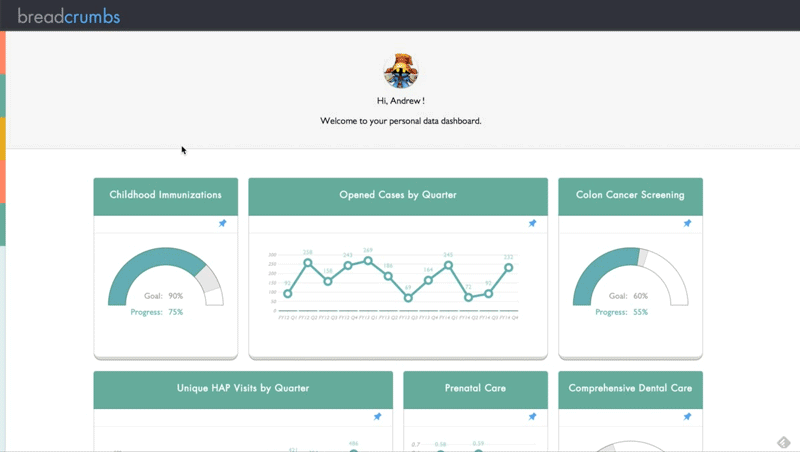
I ultimately helped the organization move from Access to Salesforce, redesigned their intake process, automated monthly and yearly reports, and built data visualizations that mapped their services across DC neighborhoods and charted monthly trends in a dashboard (right).
I have so many stories to tell about this place. A truely formative work experience.